|
|
|
Expansion
of Hong Kong |
|
|
Construction Phase Quarterly EM&A Report No.4 (1 October to 31 December 2016) |
|
Contents
The “Expansion of Hong Kong International Airport into a Three-Runway System” (the Project) serves to meet the future air traffic demands at Hong Kong International Airport (HKIA). On 7 November 2014, the Environmental Impact Assessment (EIA) Report (Register No.: AEIAR-185/2014) for the Project was approved and an Environmental Permit (EP) (Permit No.: EP-489/2014) was issued for the construction and operation of the Project.
Airport Authority Hong Kong (AAHK) commissioned Mott MacDonald Hong Kong Limited (MMHK) to undertake the role of Environmental Team (ET) for carrying out the Environmental Monitoring & Audit (EM&A) works during the construction phase of the Project in accordance with the Updated EM&A Manual.
This is the 4th Construction Phase Quarterly EM&A Report for the Project which summarizes the monitoring results and audit findings of the EM&A programme during the reporting period from 1 October 2016 to 31 December 2016.
Key Activities in the
Reporting Period
Key activities of the Project carried out in the reporting period were related to the following contracts:
Advanced Works:
Contract P560 (R) Aviation Fuel Pipeline Diversion Works
· Horizontal Directional Drilling (HDD) work at launching site and Sheung Sha Chau;
· Stockpiling of excavated materials from HDD operation at stockpiling area;
· Site preparation works and construction of containment pit on Sheung Sha Chau Island; and
· Casing installation and pipeline supporting works on Sheung Sha Chau Island.
Reclamation Works:
Contracts 3201 to 3205 Deep Cement Mixing (DCM) Works
· Laying of geotextile and sand blanket; and
· DCM trial works.
Other Works:
Contract 3213 CLP Cable Diversion Enabling Works
· Installation of silt curtain;
· Excavation works and removal of armour rock at the western part of the airport;
· Construction of drawpit; and
· Installation of cable trough, backfilling, and reinstatement of armour rock.
EM&A Activities Conducted in the Reporting Period
The EM&A programme was undertaken in accordance with the Updated EM&A Manual of the Project. A summary of the monitoring and audit activities during this reporting period is presented as below:
|
Monitoring/ Audit Activities |
Number of Sessions |
|
1-hour Total Suspended Particulates (TSP) Air Quality Monitoring |
96 |
|
Noise Monitoring |
65 |
|
Water Monitoring |
39 |
|
Ecological Monitoring |
3 |
|
Vessel line-transect surveys for Chinese White Dolphin (CWD) monitoring |
6 |
|
Land-based theodolite tracking survey effort for CWD monitoring |
15 |
|
|
|
|
|
Dolphin Observers Training |
Ecological Monitoring |
Night Vision Device Testing for Dolphin Exclusion Zone Monitoring |

In total, 2,543 ferry movements between HKIA SkyPier and Zhuhai / Macau were audited in the reporting period. All the High Speed Ferries (HSFs) had travelled through the Speed Control Zone (SCZ) with average speeds within 15 knots, which complied with the SkyPier Plan, except one HSF travelled at an average speed of 16.4 knots as the captain had to give way to an approaching vessel to ensure safety. Nine ferry movements had minor deviations from the diverted route during the reporting period and all of them are related to public safety / emergency situations. In November, one ferry did not travel through the diverted route as the concerned captain decided to bypass the SCZ due to passenger misbehaviour incident happened during passenger loading at SkyPier. After the incident, the concerned captain has been instructed to follow the requirements of the Marine Travel Routes and Management Plan for HSFs of SkyPier (the SkyPier Plan).
Between October and December 2016, ET has conducted weekly audit of relevant information to ensure the contractors have provided sufficient information to the Marine Traffic Control Center (MTCC) and the contractors are fully complied with the requirements of the Marine Travel Routes and Management Plan for Construction and Associated Vessel (MTRMP-CAV). A total of 14 skipper training workshops have been held by ET between October to December 2016 with concerned captains of construction vessels associated with 3RS contracts. Another 16 skipper training workshops have been held by contractors’ Environmental Officers (EO) and competency test had been conducted subsequently with the trained captains by ET.
On the implementation of Marine Mammal Watching Plan, silt curtains were in place by the contractor of CLP cable diversion enabling works as well as the DCM contractors for sand blanket laying works and dolphin observers were deployed in accordance with the Plan. On the implementation of Dolphin Exclusion Zone (DEZ) Plan, DCM trials associated dolphin observers were deployed by contractors for continuous monitoring of the DEZ for DCM works in accordance with the DEZ Plan. Trainings for the dolphin observers were provided by the ET prior to the aforementioned works, with the training records kept by the ET. Testing on night vision devices for DEZ monitoring was also conducted before the DCM trials. From the contractors’ daily observation records and DEZ monitoring log records, no dolphin or other marine mammals were observed within or around the DEZ and silt curtains during this reporting quarter.
Review of Environmental Quality Performance Limits (Action and Limit levels)
For water quality, the monitoring results for dissolved oxygen (DO), total alkalinity, and chromium obtained during the reporting period were in compliance with their corresponding Action and Limit Levels. For turbidity, suspended solids (SS) and nickel, some of the testing results had exceeded the relevant Action or Limit Levels during the reporting period. Actions had been taken according to the Event and Action Plan of the EM&A Manual. Investigations were carried out immediately for each of the exceedance cases, and the investigation findings concluded that all the exceedances were not due to the Project.
No breach of the Action or Limit Levels in relation to the construction dust, noise, waste and CWD monitoring were recorded during the reporting period.
Implementation Status and Review of Environmental Mitigation Measures
Weekly site audits were carried out during the reporting period to confirm the implementation measures undertaken by the Contractors. Environmental issues related to the construction activities, including air quality, noise, waste, CWD, ecology and landscape & visual were monitored and/or reviewed.
The recommended environmental mitigation measures, as included in the EM&A programme, were implemented properly in the reporting period. The EM&A programme effectively monitored the construction activities and ensure the proper implementation of mitigation measures.
Summary Findings of the EM&A Programme
The following table summarizes the key findings of the EM&A programme during the reporting period:
|
|
Yes |
No |
Details |
Analysis / Recommendation / Remedial Actions |
|
Breaches of Limit Level^ |
|
ü |
No project-related limit level exceedance was recorded. |
Nil |
|
Breaches of Action Level^
|
|
ü |
No project-related action level exceedance was recorded. |
Nil |
|
Complaints Received |
ü |
|
A complaint on night time work at Sheung Sha Chau was received on 29 Dec 2016. |
The complaint is currently under investigation in accordance with the Complaint Management Plan |
|
Notification of any summons and status of prosecutions |
|
ü |
Neither notifications of summons nor prosecution were received. |
Nil |
|
Changes that affect the EM&A |
ü |
|
The Baseline Water Quality Monitoring Report was updated on 12 December 2016. There were no changes to the construction works that may affect the EM&A. |
Nil |
Remarks: ^ only exceedance of action/ limit level related to Project works will be highlighted.
1
Introduction
1.1
Background
On 7 November 2014, the Environmental Impact Assessment (EIA) Report (Register No.: AEIAR-185/2014) for the “Expansion of Hong Kong International Airport into a Three-Runway System” (the Project) was approved and an Environmental Permit (EP) (Permit No.: EP-489/2014) was issued for the construction and operation of the Project.
Airport Authority Hong Kong (AAHK) commissioned Mott MacDonald Hong Kong Limited (MMHK) to undertake the role of Environmental Team (ET) for carrying out the Environmental Monitoring & Audit (EM&A) works during the construction phase of the Project in accordance with the Updated EM&A Manual (the Manual) submitted under EP Condition 3.1. The Manual is available on the Project’s dedicated website (accessible at: http://env.threerunwaysystem.com/en/index.html). AECOM Asia Company Limited (AECOM) was employed by AAHK as the Independent Environmental Checker (IEC) for the Project.
The Project covers the expansion of the existing airport into a three-runway system (3RS) with key project components comprising land formation of about 650 ha and all associated facilities and infrastructure including taxiways, aprons, aircraft stands, a passenger concourse, an expanded Terminal 2, all related airside and landside works and associated ancillary and supporting facilities. The existing submarine aviation fuel pipelines and submarine power cables also require diversion as part of the works.
Construction of the Project is to proceed in the general order of diversion of the submarine aviation fuel pipelines, diversion of the submarine power cables, land formation, and construction of infrastructure, followed by construction of superstructures.
The updated overall phasing programme of all construction works was presented in Appendix A of the Construction Phase Monthly EM&A Report No. 7. Contract information is presented in Appendix A.
1.2
Scope of this Report
This is the 4th Construction Phase Quarterly EM&A Report for the Project which summarizes the key findings of the EM&A programme during the reporting period from 1 October 2016 to 31 December 2016.
1.3
Project Organisation
The Project’s organisation structure and the contact details of the key personnel are provided in Appendix B and Table 1.1 respectively.
Table 1.1: Contact Information of Key Personnel
|
Party |
Position |
Name |
Telephone |
|
Project Manager’s Representative (Airport Authority Hong Kong) |
Senior Manager, Environment |
Lawrence Tsui |
2183 2734 |
|
Environmental Team (ET) (Mott MacDonald Hong Kong Limited) |
Environmental Team Leader |
Terence Kong |
2828 5919 |
|
|
Deputy Environmental Team Leader |
Heidi Yu |
2828 5704 |
|
|
Deputy Environmental Team Leader |
Keith Chau |
2972 1721 |
|
Independent Environmental Checker (IEC) (AECOM Asia Company Limited) |
Independent Environmental Checker |
Jackel Law |
3922 9376
|
|
|
Deputy Independent Environmental Checker |
Joanne Tsoi |
3922 9423 |
|
Advanced Works: |
|
|
|
|
Contract P560(R) Aviation Fuel Pipeline Diversion Works (Langfang Huayuan Mechanical and Electrical Engineering Co., Ltd.) |
Project Manager
|
Wei Shih
|
2117 0566
|
|
Environmental Officer |
Lyn Lau
|
5172 6543
|
|
|
DCM Works: |
|
|
|
|
Contract 3201 DCM (Package 1) (Penta-Ocean-China State-Dong-Ah Joint Venture) |
Project Director
|
Tsugunari Suzuki
|
9178 9689 |
|
|
Environmental Officer
|
Kanny Cho
|
9019 1962 |
|
Contract 3202 DCM (Package 2) (Samsung-BuildKing Joint Venture) |
Project Manager
|
Ilkwon Nam
|
9643 3117 |
|
|
Environmental Officer
|
Dickson Mak
|
9525 8408 |
|
Contract 3203 DCM (Package 3) (Sambo E&C Co., Ltd.) |
Project Manager
|
Seong Jae Park
|
9683 8693 |
|
|
Environmental Officer
|
Calvin Leung
|
9203 5820 |
|
Contract 3204 DCM (Package 4) (CRBC-SAMBO Joint Venture) |
Project Manager
|
Kyung-Sik Yoo
|
9683 8697
|
|
|
Environmental Officer
|
David Man |
6421 3238 |
|
Contract 3205 DCM (Package 5) (Bachy Soletanche - Sambo Joint Venture) |
Deputy Project Director |
Min Park |
9683 0765 |
|
|
Environmental Officer
|
Margaret Chung |
9130 3696 |
|
Reclamation Works: |
|
|
|
|
Contract 3206 (ZHEC-CCCC-CDC Joint Venture) |
Project Manager |
Kim Chuan Lim |
3693 2288 |
|
|
Environmental Officer
|
Kwai Fung Wong
|
3693 2252 |
|
Other Works: |
|
|
|
|
Contract 3213 CLP Cable Diversion Enabling Works (Wing Hing Construction Company)
|
Project Manager
|
Micheal Kan |
9206 0550 |
|
|
Environmental Officer
|
Ivy Tam |
2151 2090 |
1.4
Contact information for the Project
The contact information for the Project is provided in Table 1.2. The public can contact us through the following channels if they have any queries and comments on the environmental monitoring data and project related information.
Table 1.2: Contact Information of the Project
|
Channels |
Contact Information |
|
Hotline |
3908 0354 |
|
|
|
|
Fax |
3747 6050 |
|
Postal Address |
Airport Authority Hong Kong HKIA Tower 1 Sky Plaza Road Hong Kong International Airport Lantau Hong Kong Attn: Environmental Team Leader Mr Terence Kong c/o Mr Lawrence Tsui (TRD) |
1.5
Summary of Construction Works
The key activities of the Project carried out in the reporting period included five in-progress DCM contracts, an advanced works contract, and a CLP cable diversion enabling work contract. The DCM contracts involved DCM trials, laying of geotextile and sand blanket; the advanced works contract involved HDD works including site preparation works and construction of containment pit, stockpiling of excavated materials from HDD operation, pilot hole drilling, casing installation, and pipeline supporting works; and the CLP cable diversion enabling work contract involved installation of silt curtain, excavation works and removal of armour rock, construction of drawpit, installation of cable trough, backfilling, and reinstatement of armour rocks.
The locations of the works areas are presented in Figure 1.1 to Figure 1.2. Some site investigation works were carried out during the reporting period.
1.6
Summary of EM&A Programme Requirements
The status for all environmental aspects is presented in Appendix A. The EM&A requirements remained unchanged during the reporting period.
Table 1.3: Summary of Status for All Environmental Aspects under the Updated EM&A Manual
|
Parameters |
EM&A Requirements |
Status |
|
Air Quality |
|
|
|
Baseline Monitoring |
At least 14 consecutive days before commencement of construction work |
The baseline air quality monitoring result has been reported in Baseline Monitoring Report and submitted to EPD under EP Condition 3.4. |
|
Impact Monitoring |
At least 3 times every 6 days |
On-going |
|
Noise |
|
|
|
Baseline Monitoring |
Daily for a period of at least two weeks prior to the commencement of construction works |
The baseline noise monitoring result has been reported in Baseline Monitoring Report and submitted to EPD under EP Condition 3.4. |
|
Impact Monitoring |
Weekly |
On-going |
|
Water Quality |
|
|
|
General Baseline Water Quality Monitoring for reclamation, water jetting and field joint works |
Three days per week, at mid-flood and mid-ebb tides, for at least four weeks prior to the commencement of marine works. |
The baseline water quality monitoring result has been reported in Water Quality Baseline Monitoring Report and submitted to EPD under EP Condition 3.4. |
|
General Impact Water Quality Monitoring for reclamation, water jetting and field joint works |
Three days per week, at mid-flood and mid-ebb tides. |
On-going |
|
Initial Intensive Deep Cement Mixing (DCM) Water Quality Monitoring |
At least four weeks |
To be commenced according to the detailed plan on DCM |
|
Regular DCM Water Quality Monitoring |
Three times per week until completion of DCM works. |
On-going |
|
Waste Management |
|
|
|
Waste Monitoring |
At least weekly |
On-going |
|
Land Contamination |
|
|
|
Supplementary Contamination Assessment Plan (CAP) |
At least 3 months before commencement of any soil remediation works. |
To be submitted with the relevant construction works |
|
Contamination Assessment Report (CAR) for Golf Course |
CAR to be submitted for golf course first; programme for submission of supplementary CAR at the other areas to be agreed. |
The CAR for Golf Course was submitted to EPD. |
|
Terrestrial Ecology |
|
|
|
Pre-construction Egretry Survey Egretry Survey Plan |
Once per month in the breeding season between April and July, prior to the commencement of HDD drilling works. |
The revised Egretry Survey Plan was submitted and approved by EPD under EP Condition 2.14. |
|
Ecological Monitoring |
Monthly monitoring during the HDD construction works period from August to March. |
On-going |
|
Marine Ecology |
|
|
|
Pre-Construction Phase Coral Dive Survey |
Prior to marine construction works |
The Coral Translocation Plan was submitted and approved by EPD under EP Condition 2.12. |
|
Coral Translocation |
- |
On-going |
|
Chinese White Dolphins (CWD) |
|
|
|
Baseline Monitoring |
6 months of baseline surveys before the commencement of land formation related construction works. Vessel surveys: Two full surveys per month; Land-based theodolite tracking: Two days per month at the Sha Chau station and two days per month at the Lung Kwu Chau Station; and PAM: For the whole duration of baseline period. |
Baseline CWD results were reported in the CWD Baseline Monitoring Report and submitted to EPD in accordance with EP Condition 3.4. |
|
Impact Monitoring |
Vessel surveys: Two full surveys per month; Land-based theodolite tracking: One day per month at the Sha Chau station and one day per month at the Lung Kwu Chau Station; and PAM: For the whole duration for land formation related construction works. |
On-going |
|
Landscape and Visual |
|
|
|
Baseline Monitoring |
One-off survey within the Project site boundary prior to commencement of any construction works |
The baseline landscape & visual monitoring result has been reported in Baseline Monitoring Report and submitted to EPD under EP Condition 3.4. |
|
Impact Monitoring |
Weekly |
On-going |
|
Environmental Auditing |
|
|
|
Regular site inspection |
Weekly |
On-going |
|
Marine Mammal Watching Plan (MMWP) implementation measures |
Monitor and check |
On-going |
|
Dolphin Exclusion Zone Plan (DEZP) implementation measures |
Monitor and check |
On-going |
|
SkyPier High Speed Ferries (HSF) implementation measures |
Monitor and check |
On-going |
|
Construction and Associated Vessels Implementation measures |
Monitor and check |
On-going |
|
Complaint Hotline and Email channel |
Construction phase |
On-going |
|
Environmental Log Book |
Construction phase |
On-going |
Taking into account the construction works in the reporting period, impact monitoring of air quality, noise, water quality, waste management, ecology, CWD, and landscape & visual were carried out in the reporting period.
The EM&A programme also involved weekly site inspections and related auditing conducted by the ET for checking the implementation of the required environmental mitigation measures recommended in the approved EIA Report. In order to enhance environmental awareness and closely monitor the environmental performance of the contractors, environmental briefings and regular environmental management meetings were conducted.
The EM&A programme has been following the recommendations presented in the approved EIA Report and the Updated EM&A Manual. A summary of implementation status of the environmental mitigation measures for the construction phase of the Project during the reporting period is provided in Appendix C.
2
Environmental Monitoring and
Auditing
2.1
Air Quality Monitoring
Impact 1-hour Total Suspended Particulates (TSP) monitoring was conducted three times every 6 days at two representative monitoring stations during the reporting period. The locations of monitoring stations are described in Table 2.1 and presented in Figure 2.1. The Action and Limit Levels of the air quality monitoring are also provided in Table 2.1 for reference.
Table 2.1: Impact Air Quality Monitoring Stations
|
Monitoring Station |
Location |
Action Level (mg/m3) |
Limit Level (mg/m3) |
|
AR1A |
Man Tung Road Park |
306 |
500 |
|
AR2 |
Village House at Tin Sum |
298 |
The graphical plots of impact air quality monitoring results during the reporting period are presented in Graph 1.
Graph 1: Graphical Plot of 1-hour TSP concentration at AR1A and AR2 during the Reporting Period
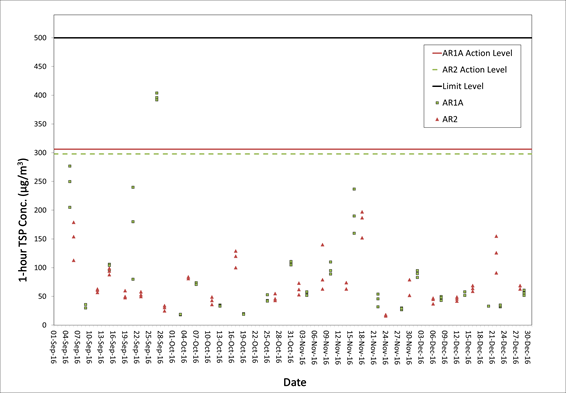
No exceedance of the Action and Limit Level was recorded at AR1 and AR2 in the reporting period.
The weather varied from sunny to rainy in the reporting quarter. Wind direction was mainly north or northwest in the reporting quarter.
The key activities of the Project carried out in the reporting period included five in-progress DCM contracts, an advanced works contract, and a CLP cable diversion enabling work contract. The DCM contracts involved DCM trials, laying of geotextile and sand blanket; the advanced works contract involved HDD pilot hole drilling, site preparation works and construction of containment pit, casing installation, and pipeline supporting works; and the CLP cable diversion enabling work contract involved installation of silt curtain, excavation works and removal of armour rock, construction of drawpit, installation of cable trough, backfilling, and reinstatement of armour rock. Those works were not likely to cause adverse dust pollution.
The active construction site is around 3 km away from the nearest air sensitive receiver in Tung Chung. The major dust sources during the reporting period were observed to be local air pollution and nearby traffic emissions. It is considered that the monitoring work in the reporting period was effective and there was no adverse impact attributable to the works of the Project.
2.2
Noise Monitoring
Impact noise monitoring was conducted at five representative monitoring stations once per week during 0700 and 1900 during the reporting period. The locations of monitoring stations are described in Table 2.2 and presented in Figure 2.1. The Action and Limit Levels of the noise monitoring are provided in Table 2.2 for reference.
The graphical plots of impact noise quality monitoring results during the reporting period are presented in Graph 2.
Table 2.2: Impact Noise Quality Monitoring Stations
|
Monitoring Station |
Location |
Action Level |
Limit Level |
|
NM1A |
Man Tung Road Park |
When one documented complaint is received from any one of the sensitive receivers |
75 dB(A) |
|
NM3A |
Site Office |
75 dB(A) |
|
|
NM4(i) |
Ching Chung Hau Po Woon Primary School |
65dB(A) / 70 dB(A) |
|
|
NM5 |
Village House in Tin Sum |
75 dB(A) |
|
|
NM6 |
House No. 1, Sha Lo Wan |
75 dB(A) |
|
|
Note: (i) reduce to 70dB(A) for school and 65dB(A) during school examination periods. |
|||
Graph 2: Graphical Plot of Leq (30min) at NM1A, NM3A, NM4, NM5 and NM6 during the Reporting Period
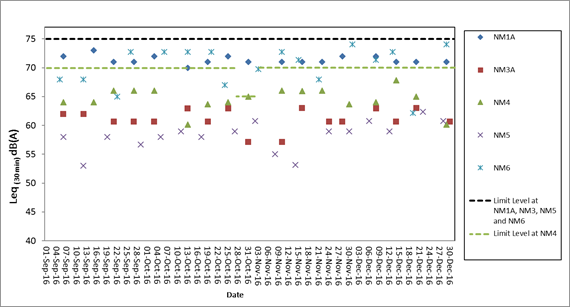
No exceedance of the Action and Limit Level was recorded at all monitoring stations in the reporting period.
The key activities undertaken in the reporting period were not likely to cause adverse noise impact. The active construction work is around 900 m away from the nearest noise sensitive receivers in the villages in North Lantau. The major noise sources during the reporting period were observed to be aircraft noise at NM3A and NM5, aircraft noise and helicopter noise at NM6, road traffic noise at NM1A, and school activities at NM4 in the background. It is considered that the monitoring work in the reporting period was effective and there was no adverse impact attributable to the works of the Project.
2.3
Water Quality Monitoring
Water quality monitoring was conducted at a total of 22 water quality monitoring stations, comprising 12 impact stations, seven sensitive receiver stations, and three control stations in the vicinity of the water quality sensitive receivers around the airport island in accordance with the Updated EM&A Manual. Table 2.3 describes the details of the monitoring stations. Figure 2.2 shows the locations of the monitoring stations.
Table 2.3: Monitoring Locations and Parameters for Impact Water Quality Monitoring
|
Monitoring Stations |
Description |
Coordinates |
Parameters |
|
|
Easting |
Northing |
|||
|
C1 |
Control |
804247 |
815620 |
|
|
C2 |
Control |
806945 |
825682 |
|
|
C3(3) |
Control |
817803 |
822109 |
|
|
IM1 |
Impact |
806458 |
818351 |
DO, pH, Temperature, Salinity, Turbidity, SS, Total Alkalinity, Heavy Metals(2) |
|
IM2 |
Impact |
806193 |
818852 |
|
|
IM3 |
Impact |
806019 |
819411 |
|
|
IM4 |
Impact |
805039 |
819570 |
|
|
IM5 |
Impact |
804924 |
820564 |
|
|
IM6 |
Impact |
805828 |
821060 |
|
|
IM7 |
Impact |
806835 |
821349 |
|
|
IM8 |
Impact |
807838 |
821695 |
|
|
IM9 |
Impact |
808811 |
822094 |
|
|
IM10 |
Impact |
809838 |
822240 |
|
|
IM11 |
Impact |
810545 |
821501 |
|
|
IM12 |
Impact |
811519 |
821162 |
|
|
SR1(1) |
Future Hong Kong-Zhuhai-Macao Bridge Hong Kong Boundary Crossing Facilities (HKBCF) Seawater Intake for cooling |
812586 |
820069 |
DO, pH, Temperature, Salinity, Turbidity, SS
|
|
SR2(3) |
Planned marine park / hard corals at The Brothers / Tai Mo To |
814166 |
821463 |
|
|
SR3 |
Sha Chau and Lung Kwu Chau Marine Park / fishing and spawning grounds in North Lantau |
807571 |
822147 |
|
|
SR4A |
Sha Lo Wan |
807810 |
817189 |
|
|
SR5A |
San Tau Beach SSSI |
810696 |
816593 |
|
|
SR6 |
Tai Ho Bay, Near Tai Ho Stream SSSI |
814663 |
817899 |
|
|
SR7 |
Ma Wan Fish Culture Zone (FCZ) |
823742 |
823636 |
|
|
SR8 |
Seawater Intake for cooling at Hong Kong International Airport (East) |
811593 |
820417 |
|
Notes:
(1) The seawater intakes of SR1 for the future HKBCF are not yet in operation, the future permanent location for SR1
during impact monitoring is subject to finalisation after the HKBCF seawater is commissioned.
(2) Details of selection criteria for the two heavy metals for early regular DCM monitoring refer to the Detailed Plan on Deep Cement Mixing available on the dedicated 3RS website http://env.threerunwaysystem.com/en/ep-submissions.html). DCM specific water quality monitoring parameters (total alkalinity and heavy metals) were only conducted at C1 to C3, SR2, and IM1 to IM12
(3) According to the baseline water quality monitoring report, C3 station is not adequately representative as a control
station of impact/ SR stations during the flood tide. The control reference has been changed from C3 to SR2 from 1 September 2016 onwards.
2.3.1
Action and Limit Levels for Water Quality Monitoring
The Action and Limit Levels for general water quality monitoring and regular DCM monitoring are presented in Table 2.4. The control and impact stations during flood tide and ebb tide for general water quality monitoring and regular DCM monitoring are presented in Table 2.5.
Table 2.4: Action and Limit Levels for General Water Quality Monitoring and Regular DCM Monitoring
|
Parameters |
Action Level (AL) |
Limit Level (LL) |
||
|
Action and Limit Levels for general water quality monitoring and regular DCM monitoring (excluding SR1& SR8) |
||||
|
DO in mg/L (Surface, Middle & Bottom) |
Surface and Middle 4.5 mg/L |
Surface and Middle 4.1 mg/L 5 mg/L for Fish Culture Zone (SR7) only |
||
|
Bottom 3.4 mg/L |
Bottom 2.7 mg/L |
|||
|
Suspended Solids (SS) in mg/L |
23 |
or 120% of upstream control station at the same tide of the same day, whichever is higher |
37 |
or 130% of upstream control station at the same tide of the same day, whichever is higher |
|
Turbidity in NTU |
22.6 |
36.1 |
||
|
Total Alkalinity in ppm |
95 |
99 |
||
|
Representative Heavy Metals for early regular DCM monitoring (Chromium) |
0.2 |
0.2 |
||
|
Representative Heavy Metals for early regular DCM monitoring (Nickel) |
3.2 |
|
3.6 |
|
|
Action and Limit Levels SR1 |
|
|
|
|
|
SS (mg/l) |
To be determined prior to its commissioning |
To be determined prior to its commissioning |
||
|
Action and Limit Levels SR8 |
|
|
|
|
|
SS (mg/l) |
52 |
|
60 |
|
Note:
1. For DO measurement, non-compliance occurs when monitoring result is lower than the limits.
2. For parameters other than DO, non-compliance of water quality results when monitoring results is higher than the limits.
3. Depth-averaged results are used unless specified otherwise.
4. Details of selection criteria for the two heavy metals for early regular DCM monitoring refer to the Detailed Plan on Deep Cement Mixing available on the dedicated 3RS website http://env.threerunwaysystem.com/en/ep-submissions.html)
5. The action and limit levels for the two representative heavy metals chosen will be the same as that for the intensive DCM monitoring.
Table 2.5: The Control and Impact Stations during Flood Tide and Ebb Tide for General Water Quality Monitoring and Regular DCM Monitoring
|
Control Station |
Impact Stations |
|
Flood Tide |
|
|
C1 |
IM1, IM2, IM3, IM4, IM5, IM6, IM7, IM8, SR3 |
|
SR2^1 |
IM7, IM8, IM9, IM10, IM11, IM12, SR1A, SR3, SR4A, SR5A, SR6, SR8 |
|
Ebb Tide |
|
|
C1 |
SR4A, SR5A, SR6 |
|
C2 |
IM1, IM2, IM3, IM4, IM5, IM6, IM7, IM8, IM9, IM10, IM11, IM12, SR1A, SR2, SR3, SR7, SR8 |
^1 As per findings of Baseline Water Quality Monitoring Report, the control reference has been changed from C3 to SR2 from 1 Sep 2016 onwards.
2.3.2
Summary of Monitoring Results
During the reporting period, water quality monitoring was conducted at 12 impact stations (IM), seven sensitive receiver (SR) stations and three control stations in the vicinity of water quality sensitive receivers around the airport island in accordance with the Updated EM&A Manual. The purpose of water quality monitoring at the IM stations is to promptly capture any potential water quality impacts from the Project before the impacts could become apparent at sensitive receivers (represented by the SR stations).
The monitoring results for DO, total alkalinity, and chromium obtained during the reporting period were in compliance with their corresponding Action and Limit Levels. For turbidity, SS and nickel, some of the testing results had exceeded the relevant Action Levels or Limit Levels during the reporting period. Investigations were carried out immediately for each of the exceedance cases, and the investigation findings concluded that all the exceedances were not due to the Project. Summaries of turbidity, SS, and nickel compliance status are presented in Table 2.6 to 2.10.
Findings for Turbidity Exceedance
Table 2.6 and Table 2.7 presents a summary of the turbidity compliance status at IM and SR stations during mid-ebb and mid-flood tide for the reporting quarter.
Table 2.6: Summary of Turbidity Compliance Status at IM and SR Stations (Mid-Ebb Tide)
|
Date |
IM1 |
IM2 |
IM3 |
IM4 |
IM5 |
IM6 |
IM7 |
IM8 |
IM9 |
IM10 |
IM11 |
IM12 |
SR2 |
SR3 |
SR4A |
SR5A |
SR6 |
SR7 |
SR8 |
|
19/11/2016 |
|
|
|
|
|
|
|
||||||||||||
|
No. of Turbidity Exceedances |
0 |
0 |
0 |
1 |
0 |
0 |
0 |
0 |
0 |
0 |
0 |
0 |
0 |
0 |
0 |
0 |
0 |
0 |
0 |
Table 2.7: Summary of Turbidity Compliance Status at IM and SR Stations (Mid-Flood Tide)
|
Date |
IM1 |
IM2 |
IM3 |
IM4 |
IM5 |
IM6 |
IM7 |
IM8 |
IM9 |
IM10 |
IM11 |
IM12 |
SR2 |
SR3 |
SR4A |
SR5A |
SR6 |
SR7 |
SR8 |
|
01/10/2016 |
|
|
|
|
|
|
|
||||||||||||
|
01/11/2016 |
|
|
|
|
|
|
|
||||||||||||
|
17/11/2016 |
|
|
|
|
|
|
|
||||||||||||
|
No. of Turbidity Exceedances |
0 |
0 |
0 |
0 |
0 |
0 |
0 |
0 |
1 |
1 |
0 |
1 |
0 |
0 |
0 |
0 |
0 |
0 |
0 |
Note: The monitoring dates that are not presented in the above tables were in full compliance with their corresponding Action and Limit Levels. Detailed results are presented in Appendix D.
Legend:
|
|
No exceedance of Action Level and Limit Level |
|
|
Exceedance of Action Level recorded at monitoring station located downstream of the 3RS Project based on dominant tidal flow |
|
|
Exceedance of Action Level recorded at monitoring station located upstream of the 3RS Project based on dominant tidal flow |
|
|
Upstream station with respect to 3RS Project during the respective tide based on dominant tidal flow |
Investigations were conducted for each of exceedances and details of the investigation findings are presented in the Construction Phase Monthly EM&A Report no. 10 and 11. All exceedances were found to be not due to the Project.
IM Stations
Overall, the turbidity exceedances that occurred during this reporting quarter appeared to be very sporadic and isolated cases with neither temporal nor spatial trend to indicate that the turbidity exceedances were linked to Project activities. Such isolated cases appear to be more characteristic of natural fluctuation, and this is supported by the baseline monitoring which also showed occasionally elevated turbidity levels that are of a magnitude similar to or greater than the turbidity exceedances that occurred during this reporting quarter.
SR Stations
There were no turbidity exceedances at any SR stations.
Findings for SS Exceedances
Table 2.8 and Table 2.9 presents a summary of the SS compliance status at IM and SR stations during mid-ebb and mid-flood tide for the reporting quarter.
Table 2.8: Summary of SS Compliance Status at IM and SR Stations (Mid-Ebb Tide)
|
Date |
IM1 |
IM2 |
IM3 |
IM4 |
IM5 |
IM6 |
IM7 |
IM8 |
IM9 |
IM10 |
IM11 |
IM12 |
SR2 |
SR3 |
SR4A |
SR5A |
SR6 |
SR7 |
SR8 |
|
04/10/2016 |
|
|
|
|
|
|
|
||||||||||||
|
15/10/2016 |
|
|
|
|
|
|
|
|
|
|
|
|
|
|
|
|
|
|
|
|
20/10/2016 |
|
|
|
|
|
|
|
|
|
|
|
|
|
|
|
|
|
|
|
|
25/10/2016 |
|
|
|
|
|
|
|
|
|
|
|
|
|
|
|
|
|
|
|
|
12/11/2016 |
|
|
|
|
|
|
|
|
|
|
|
|
|
|
|
|
|
|
|
|
15/11/2016 |
|
|
|
|
|
|
|
|
|
|
|
|
|
|
|
|
|
|
|
|
19/11/2016 |
|
|
|
|
|
|
|
|
|
|
|
|
|
|
|
|
|
|
|
|
26/11/2016 |
|
|
|
|
|
|
|
|
|
|
|
|
|
|
|
|
|
|
|
|
29/11/2016 |
|
|
|
|
|
|
|
|
|
|
|
|
|
|
|
|
|
|
|
|
01/12/2016 |
|
|
|
|
|
|
|
|
|
|
|
|
|
|
|
|
|
|
|
|
03/12/2016 |
|
|
|
|
|
|
|
|
|
|
|
|
|
|
|
|
|
|
|
|
No. of SS Exceedances |
2 |
3 |
2 |
3 |
2 |
5 |
2 |
0 |
1 |
1 |
0 |
0 |
0 |
3 |
5 |
0 |
0 |
0 |
0 |
Table 2.9: Summary of SS Compliance Status at IM and SR Stations (Mid-Flood Tide)
|
Date |
IM1 |
IM2 |
IM3 |
IM4 |
IM5 |
IM6 |
IM7 |
IM8 |
IM9 |
IM10 |
IM11 |
IM12 |
SR2 |
SR3 |
SR4A |
SR5A |
SR6 |
SR7 |
SR8 |
|
04/10/2016 |
|
|
|
|
|
|
|
||||||||||||
|
15/10/2016 |
|
|
|
|
|
|
|
|
|
|
|
|
|
|
|
|
|
|
|
|
20/10/2016 |
|
|
|
|
|
|
|
|
|
|
|
|
|
|
|
|
|
|
|
|
22/10/2016 |
|
|
|
|
|
|
|
|
|
|
|
|
|
|
|
|
|
|
|
|
25/10/2016 |
|
|
|
|
|
|
|
|
|
|
|
|
|
|
|
|
|
|
|
|
01/11/2016 |
|
|
|
|
|
|
|
|
|
|
|
|
|
|
|
|
|
|
|
|
03/11/2016 |
|
|
|
|
|
|
|
|
|
|
|
|
|
|
|
|
|
|
|
|
05/11/2016 |
|
|
|
|
|
|
|
|
|
|
|
|
|
|
|
|
|
|
|
|
08/11/2016 |
|
|
|
|
|
|
|
|
|
|
|
|
|
|
|
|
|
|
|
|
12/11/2016 |
|
|
|
|
|
|
|
|
|
|
|
|
|
|
|
|
|
|
|
|
15/11/2016 |
|
|
|
|
|
|
|
|
|
|
|
|
|
|
|
|
|
|
|
|
17/11/2016 |
|
|
|
|
|
|
|
|
|
|
|
|
|
|
|
|
|
|
|
|
19/11/2016 |
|
|
|
|
|
|
|
|
|
|
|
|
|
|
|
|
|
|
|
|
24/11/2016 |
|
|
|
|
|
|
|
|
|
|
|
|
|
|
|
|
|
|
|
|
29/11/2016 |
|
|
|
|
|
|
|
|
|
|
|
|
|
|
|
|
|
|
|
|
17/12/2016 |
|
|
|
|
|
|
|
|
|
|
|
|
|
|
|
|
|
|
|
|
20/12/2016 |
|
|
|
|
|
|
|
|
|
|
|
|
|
|
|
|
|
|
|
|
27/12/2016 |
|
|
|
|
|
|
|
|
|
|
|
|
|
|
|
|
|
|
|
|
No. of SS Exceedances |
2 |
3 |
3 |
1 |
0 |
1 |
1 |
0 |
0 |
1 |
2 |
3 |
0 |
0 |
6 |
1 |
9 |
0 |
0 |
Note: The monitoring dates that are not presented in the above tables were in full compliance with their corresponding Action and Limit Levels. Detailed results are presented in Appendix D.
Legend:
|
|
No exceedance of Action Level and Limit Level |
|
|
Exceedance of Action Level recorded at monitoring station located downstream of the 3RS Project based on dominant tidal flow |
|
|
Exceedance of Action Level recorded at monitoring station located upstream of the 3RS Project based on dominant tidal flow |
|
|
Exceedance of Limit Level recorded at monitoring station located downstream of the 3RS Project based on dominant tidal flow |
|
|
Exceedance of Limit Level recorded at monitoring station located upstream of the 3RS Project based on dominant tidal flow |
|
|
Upstream station with respect to 3RS Project during the respective tide based on dominant tidal flow |
Investigations were conducted for each of the exceedances and details of the investigation findings are presented in the Construction Phase Monthly EM&A Report no. 10, 11 and 12. All exceedances were found to be not due to the Project.
IM Stations
Overall, it was observed that the SS exceedances during this reporting quarter occurred frequently at those IM stations which are located upstream of the 3RS Project, particularly during mid-flood tide. Such exceedances at upstream stations would unlikely be affected by the Project.
Separately, during mid-ebb tide, it is observed that exceedances at IM stations occur at both upstream and downstream stations on the same monitoring day. Such concurrent (upstream and downstream) exceedances observed at these IM stations on the same monitoring day suggest that there might be other sources of SS that were not related to the Project.
SR Stations
At SR stations, except for SR4A during mid-ebb tide, exceedances occurred when the respective SR stations are located upstream of the Project during mid-ebb and mid-flood tide, hence exceedances at these upstream SR stations are unlikely to be due to the Project. In addition, it is noted that similarly high SS levels were observed at these SR stations during baseline monitoring, which suggested that such SS elevations are not uncommon under ambient conditions due to natural fluctuation.
Separately, some temporal trend is observed affecting SR4A during mid-ebb tide. While this SR station is located downstream of the Project during mid-ebb tide, similar exceedances at the IM stations located between the Project and the SR station was not observed on most of the monitoring days, while the baseline monitoring results at SR4A showed similarly high SS levels during baseline monitoring. It is thus considered that such SS elevations are not uncommon under ambient conditions due to natural fluctuation.
Findings for Nickel Exceedances
Table 2.10 presents a summary of the nickel compliance status at IM and SR stations for the reporting quarter. There were no nickel exceedances during mid-ebb tide for the reporting quarter.
Table 2.10: Summary of Nickel Compliance Status at IM Stations (Mid-Flood Tide)
|
Date |
IM1 |
IM2 |
IM3 |
IM4 |
IM5 |
IM6 |
IM7 |
IM8 |
IM9 |
IM10 |
IM11 |
IM12 |
SR2 |
SR3 |
SR4A |
SR5A |
SR6 |
SR7 |
SR8 |
|
22/11/2016 |
|
|
|
|
|
|
|
|
|
|
|
|
|
|
|
|
|||
|
No. of nickel Exceedances |
0 |
0 |
0 |
0 |
0 |
0 |
1 |
1 |
1 |
0 |
0 |
0 |
0 |
0 |
0 |
0 |
0 |
0 |
0 |
Note: The monitoring dates that are not presented in the above table were in full compliance with their corresponding Action and Limit Levels. Detailed results are presented in Appendix D.
Legend:
|
|
No exceedance of Action Level and Limit Level |
|
|
Exceedance of Action Level recorded at monitoring station located downstream of the 3RS Project based on dominant tidal flow |
|
|
Exceedance of Action Level recorded at monitoring station located upstream of the 3RS Project based on dominant tidal flow |
|
|
Exceedance of Limit Level recorded at monitoring station located downstream of the 3RS Project based on dominant tidal flow |
|
|
Exceedance of Limit Level recorded at monitoring station located upstream of the 3RS Project based on dominant tidal flow |
|
|
Upstream station with respect to 3RS Project during the respective tide based on dominant tidal flow |
Investigations were conducted for each of the exceedances and details of the investigation findings are presented in the Construction Phase Monthly EM&A Report no. 11. All exceedances were found to be not due to the Project.
IM Stations
Nickel is a representative heavy metal for DCM monitoring, however, the investigations found that no DCM activities were conducted during the monitoring period. Hence it is considered that occasional elevations in nickel levels may arise due to other sources not associated with the Project.
SR Stations
There were no nickel exceedances at any SR stations.
Conclusions
Based on the findings of the exceedance investigations presented in Construction Phase Monthly EM&A Report no. 10, 11 and 12, it was concluded that the exceedances during this reporting quarter were not due to the Project. Hence no SR stations were adversely affected by the Project. All required actions under the Event and Action Plan had been followed. Exceedances appeared to be due to natural fluctuation (such as naturally higher baseline SS levels at individual SR stations) or other sources not related to the Project.
Nevertheless, recognising that the IM stations represent a ‘first line of defense’, the non-project related exceedances identified at IM stations have been attended to as triggers of precautionary measures. As part of the EM&A programme, the construction methods and mitigation measures for water quality will continue to be monitored and opportunities for further enhancement will continue to be explored and implemented where possible, to strive for better protection of water quality and the marine environment.
In the meantime, the contractors were reminded to implement and maintain all mitigation measures during weekly site inspection. These include maintaining the silt curtain for sand blanket laying properly and maintaining the levels of materials on barges to avoid overflow as recommended in the EM&A Manual.
2.4 Waste Monitoring
In accordance with the Updated EM&A Manual, the waste generated from construction activities was audited once per week to determine if wastes were being managed in accordance with the Waste Management Plan (WMP) prepared for the Project, contract-specific WMP, and any statutory and contractual requirements. All aspects of waste management including waste generation, storage, transportation and disposal were assessed during the audits. The Action and Limit Levels of the construction waste are provided in Table 2.11.
Table 2.11: Action and Limit Levels for Construction Waste
|
Monitoring Stations |
Action Level |
Limit Level |
|
Construction Area |
When one valid documented complaint is received |
Non-compliance of the WMP, contract-specific WMPs, any statutory and contractual requirements |
Weekly waste monitoring of the Project construction works was carried out by the ET to check and monitor the implementation of proper waste management practices during the construction phase during the reporting period.
Recommendations were provided during monitoring including provision of drip trays for chemical containers, provision of proper label for chemical containers, proper disposal of sewage effluent from construction workforce as well as proper collection, sorting and disposal of C&D materials. In addition, relevant contractors were reminded to provide spill kit and chemical storage area, and to handle the chemical waste properly. The contractors had taken actions to implement the recommended measures.
Based on the updated information, metals and paper were recycled and about 395m3 of excavated materials were produced from the HDD launching site and Sheung Sha Chau under P560(R) during the reporting period. The generated excavated materials were temporarily stored at storage and stockpiling area. The excavated material will be reused in the Project.
During the reporting period, around 29 tonnes of general refuse and 0.36 tonnes of chemical waste were disposed of to the West New Territories (WENT) Landfill and Tsing Yi Chemical Waste Treatment Centre respectively. No Construction and Demolition (C&D) material was disposed off-site during the reporting period.
No exceedance of the Action or Limit Levels was recorded in the reporting period.
2.5
CWD Monitoring
2.5.1
Summary of Monitoring Requirements
CWD monitoring was conducted by vessel line-transect survey at a frequency of two full survey per month, supplemented by land-based theodolite tracking for twice per month at the Sha Chau station and three times per month at the Lung Kwu Chau station as well as Passive Acoustic Monitoring. Monitoring was fully completed in the reporting period. The locations of CWD monitoring by vessel survey transect are shown in Figure 2.3, whilst the land-based survey stations are described in Table 2.12 and depicted in Figure 2.4. Location of Passive Acoustic Monitoring is shown in Figure 2.10.
Table 2.12: Land-based Survey Station Details
|
Stations |
Location |
Geographical Coordinates |
Station Height (m) |
Approximate Tracking Distance (km) |
|
D |
Sha Chau (SC) |
22° 20’ 43.5” N 113° 53’ 24.66” E |
45.66 |
2 |
|
E |
Lung Kwu Chau (LKC) |
22° 22’ 44.83” N 113° 53’ 0.2” E |
70.40 |
3 |
The Action Level (AL) and Limit Level (LL) for CWD monitoring were formulated by an action response approach using the running quarterly dolphin encounter rates (STG and ANI) derived from baseline monitoring data, as presented in the CWD Baseline Monitoring Report. The derived values of AL and LL for CWD monitoring are shown in Table 2.13.
Table 2.13: Derived Values of Action Level (AL) and Limit Level (LL) for Chinese White Dolphin Monitoring
|
|
NEL, NWL, AW, WL and SWL as a Whole |
|
Action Level |
Running quarterly STG < 1.86 & ANI < 9.35 |
|
Limit Level |
Two consecutive running quarterly (3-month) STG < 1.86 & ANI < 9.35 |
2.5.2
Summary
of Monitoring Results
Vessel Line-transect Survey
Survey Effort
During the reporting period, six complete sets of vessel line-transect surveys were conducted from October to December 2016 to cover all transects in NEL, NWL, AW, WL and SWL survey area twice per month.
A total of around 1396 km of survey effort was collected from these surveys, with around 83.8% of the total survey effort being conducted under favourable weather condition (i.e. Beaufort Sea State 3 or below with favourable visibility). Details of the survey effort data were presented in Appendix E.
Sighting Distribution
From October to December 2016, 59 groups of CWD with 156 individuals were sighted. Amongst the sightings of CWD, 47 groups with 128 individuals were made during on-effort search under favourable weather condition.
When breaking down the sightings by survey areas, 15 sightings with 54 individuals, 18 sightings with 46 individuals and 14 sightings with 28 individuals were recorded in NWL, WL and SWL respectively within this reporting quarter. No CWD was sighted in NEL and AW survey areas. It is specifically noted from the record in NWL that the numbers of sightings and CWD individuals show an observable re-bounce in December 2016 (8 sightings with 30 individuals) compared to the previous two months (4 sightings with 12 individuals in October and 3 sightings with 12 individuals in November 2016), in which the numbers of sightings and individuals in December are both greater than the sums of October and November 2016.
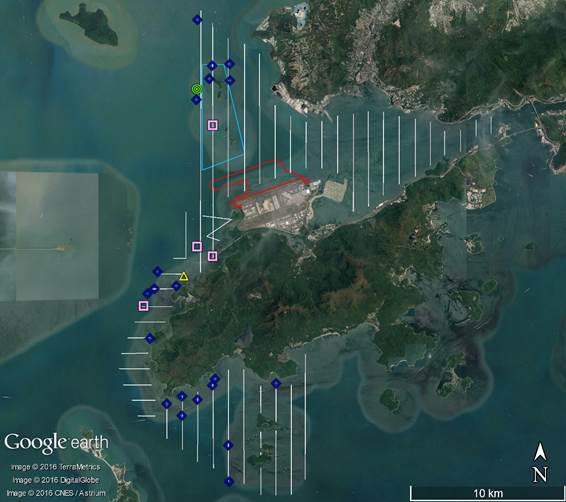
Distribution of CWD sightings recorded from October to December 2016 during on-effort search under favourable weather condition are illustrated in Figure 2.5. CWD sightings were relatively more frequent in WL than in NWL and SWL. In NWL, sightings were mainly recorded around Lung Kwu Chau. Two sightings were recorded in the southwestern corner of NWL survey area close to the Hong Kong-Zhuhai-Macao Bridge Hong Kong Link Road alignment. No sightings of CWDs were recorded within or in close vicinity of the 3RS land-formation footprint. CWD sightings in WL were evenly distributed in both coastal and off-shore areas near Tai O. In SWL waters, CWDs were most frequently sighted along the coast from Fan Lau to Lo Kei Wan, with a few scattered sightings around Soko Islands. Details of the sighting data were presented in Appendix E.
Figure 2.5: Sightings Distribution of Chinese White Dolphins
[Pink circle: Sighting locations of CWD, White line: Vessel survey transects, Blue polygon: Sha Chau and Lung Kwu Chau Marine Park (SCLKCMP), Red polygon: 3RS land-formation footprint]
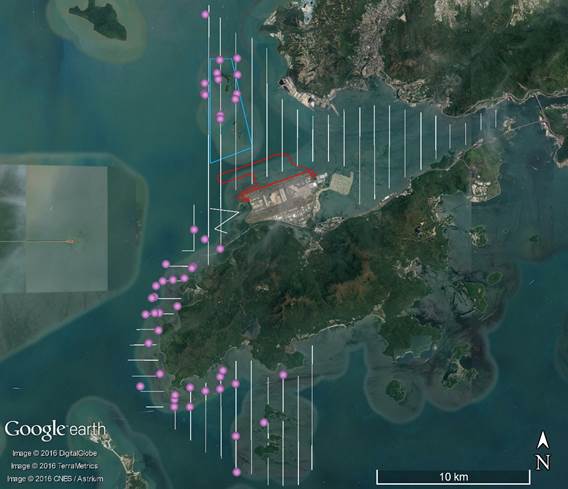
Note: Only on-effort sightings under Beaufort 3 or below were presented in the figure.
Encounter Rate
The dolphin encounter rates for the number of dolphin sightings per 100km survey effort (STG) and for the total number of dolphins per 100km survey effort (ANI) in the whole survey area (i.e. NEL, NWL, AW, WL and SWL) for October, November and December 2016 are summarized in Table 2.14.
In this reporting quarter, both the monthly and running quarterly encounter rates STG and ANI show decline in November 2016 but re-bounce in December 2016. Comparing with the previous reporting quarter (i.e. August to September 2016), the dolphin encounter rates (both STG and ANI) show a decline from the previous quarter, from 4.29 to 4.02 and 18.32 to 10.95 respectively, attributed to the drops of dolphin sightings in October and November 2016.
Table 2.14: Summary of Monthly and Running Quarterly STG and ANI of Chinese White Dolphin for Previous and Current Reporting Quarters
|
|
Previous Reporting Quarter |
Current Reporting Quarter |
|||
|
|
Aug 16 |
Sep 16 |
Oct 16 |
Nov 16 |
Dec 16 |
|
Monthly STG |
3.48 |
3.50 |
4.65 |
2.54 |
4.89 |
|
Monthly ANI |
14.17 |
14.65 |
9.81 |
7.11 |
15.96 |
|
Running Quarterly STG |
4.93 |
4.29 |
3.84 |
3.55 |
4.02 |
|
Running Quarterly ANI |
20.57 |
18.32 |
13.02 |
10.74 |
10.95 |
Note: For detailed calculations of encounter rates STG and ANI, please refer to the Monthly EM&A Reports No. 10, No. 11 and No. 12.
Group Size
Between October and December 2016, the group size of CWDs ranged from 1 to 11 individuals per group. The average group size of CWDs was 2.7 individuals per group. The majority of the CWD sightings, with a total number of 31 groups out of the 47 groups were in small group size (i.e. 1-2 individuals). In NWL, the numbers of sightings with small group size and with medium group size (i.e. 3-9 individuals) were similar. While in WL and SWL, CWD groups with small group size were dominant. One large CWD group with 11 individuals was sighted in coastal area between Peaked Hill and Fan Lau in WL. Sighting locations of CWD groups with different group sizes were depicted in Figure 2.6.
Figure 2.6: Sighting Locations of Chinese White Dolphins with Different Group Sizes
[Pink circle: Sighting locations of CWD with group size from 1 to 2 individuals, Green circle: Sighting locations of CWD with group size from 3 to 9 individuals, Red circle: Sighting locations of CWD with group size of 10 or above, White line: Vessel survey transects, Blue polygon: Sha Chau and Lung Kwu Chau Marine Park (SCLKCMP), Red polygon: 3RS land-formation footprint]
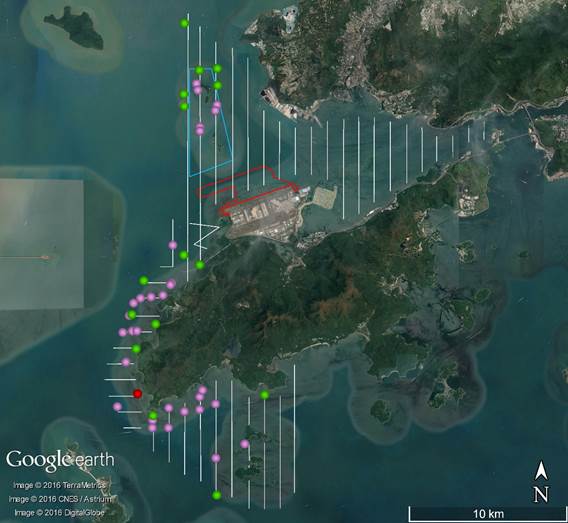
Note: Only on-effort sightings under Beaufort 3 or below were presented in the figure.
Activities and Association with Fishing Boats
During October to December 2016, 20 groups of CWDs were sighted with feeding activities. Amongst these 20 groups of feeding CWDs, one group was observed in association with operating pair trawlers at southwestern corner of Soko Islands close to the boundary of Hong Kong waters, two groups were sighted in association with operating purse seiners in NWL and SWL. In NWL waters, the majority of the feeding activities of CWDs were observed north to Lung Kwu Chau. In WL, CWDs were mainly being observed feeding in waters around Tai O. In SWL, more feeding sightings of CWDs were recorded along the coast from Fan Lau to Tai Long Wan Campgroup. The sighting locations of CWDs engaged in different behaviours during the reporting quarter were illustrated in Figure 2.7.
Figure 2.7: Sighting Locations of Chinese White Dolphins Engaged in Different Behaviours
[Indigo rhombus: Foraging, Green circle: Socializing, Pink square: Resting, Yellow triangle: Travelling, White line: Vessel survey transects, Blue polygon: SCLKCMP, Red polygon: 3RS land-formation footprint]
Note: Only on-effort sightings under Beaufort 3 or below were presented in the figure.
Mother-calf Pairs
From October to December 2016, one mother-calf and one mother-spotted juvenile pairs were sighted in NWL around SCLKCMP. The same mother-spotted juvenile pair (i.e. NLMM013 and NLMM006) was re-sighted for totally four times during the reporting quarter. The sighting locations of these two mother-calf pairs in NWL were shown in Figure 2.8. On the other hand, one mother-and-unspotted juvenile pair was sighted in SWL under Beaufort 4 sea state in November 2016.
Figure 2.8: Sighting Locations of Mother-calf Pairs
[Pink circle: Sighting locations of mother-calf pairs, White line: Vessel survey transects, Blue polygon: Sha Chau and Lung Kwu Chau Marine Park (SCLKCMP), Red polygon: 3RS land-formation footprint]
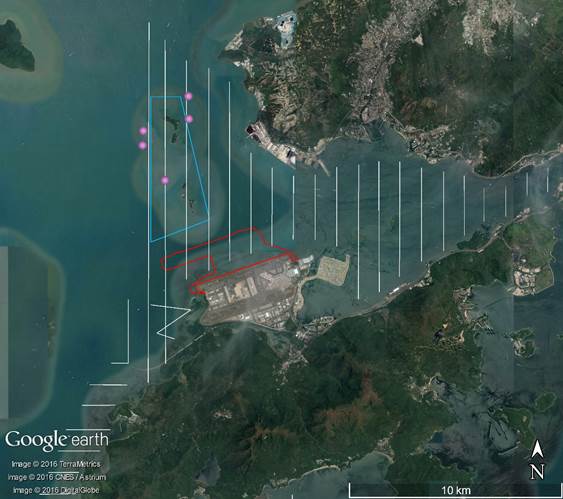
Note: Only on-effort sightings under Beaufort 3 or below were presented in the figure.
Photo Identification
During October to December 2016, a total number of 54 different CWD individuals sighted altogether 74 times were identified. Re-sighting information of CWD individuals provides an initial idea of their range use and apparent connection between different areas around Lantau. Amongst these 54 different CWD individuals, 14 animals (i.e. NLMM002, NLMM006, NLMM010, NLMM013, NLMM046, SLMM002, SLMM010, SLMM011, SLMM012, SLMM014, SLMM022, WLMM027, WLMM049 and WLMM061) were sighted more than once. Four individuals including SLMM010, SLMM011, SLMM012 and WLMM027 were re-sighted in different survey areas within this reporting quarter.
A summary of photo identification works is presented in Table 2.15. Representative photos of the 54 identified individuals and figures depicting the sighting locations of the aforementioned 14 re-sighted individuals recorded in this reporting quarter are presented Appendix E.
Table 2.15: Summary of Photo Identification
|
Individual ID |
Date of sighting |
Sighting Group No. |
Area |
|
Individual ID |
Date of sighting |
Sighting Group No. |
Area |
|
NLMM002 |
04/11/2016 |
2 |
NWL |
|
SLMM012 |
28/11/2016 |
4 |
SWL |
|
19/12/2016 |
7 |
NWL |
|
05/12/2016 |
5 |
WL |
||
|
NLMM004 |
19/12/2016 |
6 |
NWL |
|
SLMM013 |
26/10/2016 |
2 |
WL |
|
NLMM005 |
28/10/2016 |
1 |
NWL |
|
SLMM014 |
26/10/2016 |
10 |
SWL |
|
NLMM006 |
28/10/2016 |
2 |
NWL |
|
13/12/2016 |
4 |
SWL |
|
|
04/11/2016 |
2 |
NWL |
|
SLMM017 |
28/11/2016 |
4 |
SWL |
|
|
19/12/2016 |
3 |
NWL |
|
SLMM019 |
05/12/2016 |
1 |
WL |
|
|
7 |
NWL |
|
SLMM022 |
25/10/2016 |
4 |
WL |
||
|
NLMM010 |
19/12/2016 |
5 |
NWL |
|
05/12/2016 |
5 |
WL |
|
|
7 |
NWL |
|
SLMM028 |
04/11/2016 |
1 |
NWL |
||
|
NLMM012 |
28/10/2016 |
1 |
NWL |
|
SLMM029 |
05/12/2016 |
5 |
WL |
|
NLMM013 |
28/10/2016 |
2 |
NWL |
|
SLMM031 |
13/12/2016 |
7 |
SWL |
|
04/11/2016 |
2 |
NWL |
|
SLMM033 |
14/11/2016 |
1 |
SWL |
|
|
19/12/2016 |
3 |
NWL |
|
SLMM037 |
05/12/2016 |
5 |
WL |
|
|
7 |
NWL |
|
SLMM049 |
05/12/2016 |
5 |
WL |
||
|
NLMM023 |
05/10/2016 |
4 |
NWL |
|
SLMM052 |
26/10/2016 |
7 |
SWL |
|
NLMM039 |
28/10/2016 |
1 |
NWL |
|
SLMM053 |
13/12/2016 |
9 |
SWL |
|
NLMM040 |
28/10/2016 |
1 |
NWL |
|
WLMM001 |
17/11/2016 |
1 |
WL |
|
NLMM041 |
28/10/2016 |
1 |
NWL |
|
WLMM007 |
05/12/2016 |
3 |
WL |
|
NLMM042 |
28/10/2016 |
1 |
NWL |
|
WLMM026 |
04/11/2016 |
1 |
NWL |
|
NLMM043 |
21/11/2016 |
1 |
NWL |
|
WLMM027 |
05/10/2016 |
1 |
NWL |
|
NLMM044 |
21/11/2016 |
1 |
NWL |
|
24/10/2016 |
7 |
WL |
|
|
NLMM045 |
02/12/2016 |
1 |
NWL |
|
04/11/2016 |
1 |
NWL |
|
|
NLMM046 |
19/12/2016 |
2 |
NWL |
|
WLMM028 |
28/11/2016 |
6 |
SWL |
|
6 |
NWL |
|
WLMM029 |
28/11/2016 |
6 |
SWL |
||
|
NLMM047 |
19/12/2016 |
6 |
NWL |
|
WLMM030 |
19/12/2016 |
4 |
NWL |
|
NLMM048 |
19/12/2016 |
7 |
NWL |
|
WLMM032 |
26/10/2016 |
5 |
WL |
|
NLMM049 |
19/12/2016 |
7 |
NWL |
|
WLMM035 |
26/10/2016 |
5 |
WL |
|
SLMM002 |
26/10/2016 |
2 |
WL |
|
WLMM049 |
24/10/2016 |
1 |
WL |
|
05/12/2016 |
5 |
WL |
|
26/10/2016 |
3 |
WL |
||
|
SLMM003 |
05/12/2016 |
5 |
WL |
|
WLMM050 |
28/10/2016 |
1 |
NWL |
|
SLMM007 |
05/12/2016 |
3 |
WL |
|
WLMM054 |
05/10/2016 |
2 |
NWL |
|
SLMM010 |
18/11/2016 |
1 |
WL |
|
WLMM060 |
24/10/2016 |
1 |
WL |
|
05/12/2016 |
5 |
WL |
|
WLMM061 |
26/10/2016 |
1 |
WL |
|
|
13/12/2016 |
8 |
SWL |
|
5 |
WL |
|||
|
SLMM011 |
24/10/2016 |
7 |
WL |
|
WLMM062 |
17/11/2016 |
1 |
WL |
|
21/11/2016 |
1 |
NWL |
|
WLMM063 |
05/12/2016 |
4 |
WL |
Land-based Theodolite Tracking
Survey Effort
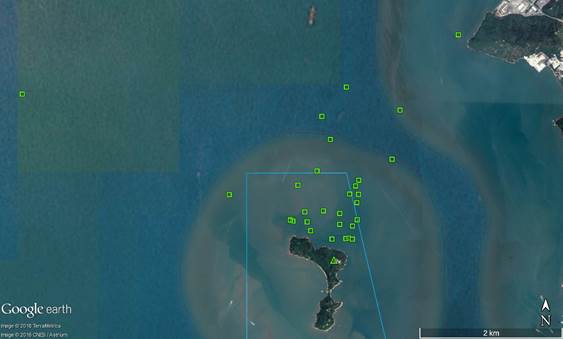
During October to December 2016, a total number of 15 days of land-based theodolite tracking survey effort was completed, including nine days on Lung Kwu Chau and six days on Sha Chau. In total, 30 CWD groups were tracked during the surveys, with overall 0.3 group of CWD sighted per hour.
Information on survey effort and CWD groups sighted during these land-based theodolite tracking surveys are presented in Table 2.16. Details on the survey effort and CWD groups tracked are presented in Appendix E. The first sighting locations of CWD groups tracked during land-based theodolite tracking surveys between October and December 2016 are shown in Figure 2.9.
Table 2.16: Summary of Survey Effort and CWD Group of Land-based Theodolite Tracking
|
Land-based Station |
# of Survey Sessions |
Survey Effort (hh:mm) |
# CWD Groups Sighted |
CWD Group Sighting per Survey Hour |
|
October 2016 |
||||
|
Lung Kwu Chau |
3 |
18:00 |
13 |
0.7 |
|
Sha Chau |
2 |
12:00 |
0 |
0 |
|
Total |
5 |
30:00 |
13 |
0.4 |
|
November 2016 |
||||
|
Lung Kwu Chau |
3 |
18:10 |
10 |
0.6 |
|
Sha Chau |
2 |
12:00 |
0 |
0 |
|
Total |
5 |
30:10 |
10 |
0.3 |
|
December 2016 |
||||
|
Lung Kwu Chau |
3 |
18:00 |
7 |
0.4 |
|
Sha Chau |
2 |
12:00 |
0 |
0 |
|
Total |
5 |
30:00 |
7 |
0.2 |
|
Overall |
15 |
90:10 |
30 |
0.3 |
Figure 2.9: Plots of First Sightings of All CWD Groups from Land-based Stations
[Green triangle: LKC station; Green square: CWD group off LKC; Blue line: SCLKCMP boundary]
Progress Update on Passive Acoustic Monitoring (PAM)
An Ecological Acoustic Recorder (EAR) has been deployed and positioned to the south of Sha Chau Island with 20% duty cycle (Figure 2.10) with data from the EAR intended primarily to supplement the data collected from the land-based theodolite station on Sha Chau. The EAR deployment generally lasts around 4-6 weeks followed by a period of data retrieval for subsequent analysis. As the data analysis takes more than two months after retrieval, PAM results are not suitable for reporting in quarterly reports. Detailed analysis of PAM data will be presented in the annual CWD report to coincide and supplement the data collected from the land-based theodolite survey station at Sha Chau.
Site Audit for CWD-related Mitigation Measures
During this reporting quarter, silt curtains were in place by the contractor of CLP cable diversion enabling works as well as the DCM contractors for sand blanket laying works and at least two dolphin observers were deployed by each contractor in accordance with the Marine Mammal Watching Plan. Teams of at least two dolphin observers were deployed by contractors for continuous monitoring of the Dolphin Exclusion Zone (DEZ) for DCM trial works in accordance with the DEZ Plan. Trainings for the dolphin observers were provided by the ET prior to the aforementioned works, with a cumulative total of 137 individuals being trained and the training records kept by the ET. Testing on night vision devices for Dolphin Exclusion Zone monitoring was also conducted before the DCM trials. From the contractors’ daily observation records and DEZ monitoring log records, no dolphin or other marine mammals were observed within or around the DEZ and silt curtains in this reporting quarter. These contractors’ records were also audited by the ET during site inspection.
Audits of acoustic decoupling for construction vessels were carried out during weekly site inspection and summarised in Section 2.6. Summary of audits of SkyPier High Speed Ferries route diversion and speed control and construction vessel management are presented in Section 2.8 and Section 2.9 respectively.
2.6
Weekly Environmental Site Inspection
Site inspections of the construction works were carried out on a weekly basis to monitor the implementation of proper environmental pollution control and mitigation measures for the Project. Bi-weekly site inspections were also conducted by the IEC. Observations have been recorded in the site inspection checklist and passed to the Contractor together with the appropriate recommended mitigation measures where necessary.
The key observations from site inspection and associated recommendations were related to:
● provision of drip trays for chemical containers;
● display of noise emission labels for air compressors;
● display of Non-road mobile machinery (NRMM) labels for generators;
● improvement of dust control and spill prevention measures;
● better maintenance of drainage channel;
● sewage effluent from construction workforce; and
● proper collection, sorting and disposal of inert and non-inert C&D materials.
In addition, recommendations were provided during site inspection on construction vessels, which include:
● provision of spill kit and chemical waste storage area for the chemical waste;
● display of Environmental Permit;
● provision of spare silt curtain on required construction vessels; and
● provision of acoustic decoupling for noisy equipment.
The daily visual inspection checklists for silt curtains and bi-weekly diver inspection records which were implemented by the contractors in accordance with the Silt Curtain Deployment Plan had been checked during site inspection and reviewed at the end of the reporting period, summarizing that the silt curtains were maintained in the correct positions and intact without obvious defects or damage.
A summary of implementation status of the environmental mitigation measures for the construction phase of the Project during the reporting period is provided in Appendix C.
2.7
Ecological Monitoring
In accordance with the Updated EM&A Manual, ecological monitoring shall be undertaken monthly at the HDD daylighting location on Sheung Sha Chau Island to identify and evaluate any impacts with appropriate actions taken as required to address and minimise any adverse impact found.
Monthly ecological monitoring was carried out in October, November and December 2016 on Sheung Sha Chau Island. No encroachment or disturbance to the egretry area at Sheung Sha Chau was recorded during ecological monitoring.
2.8
Audit of the SkyPier Plan
In total, 2,543 ferry movements between HKIA SkyPier and Zhuhai / Macau were audited in the reporting period. The daily movements of all SkyPier HSFs in the reporting period ranged between 1 and 96, which falls within the maximum daily cap number of 125.
There was only one HSF movement on 21 October 2016 as Typhoon Signal No. 8 was hoisted on that day. Status of compliance with annual daily average of 99 movements will be further reviewed in the annual EM&A Report.
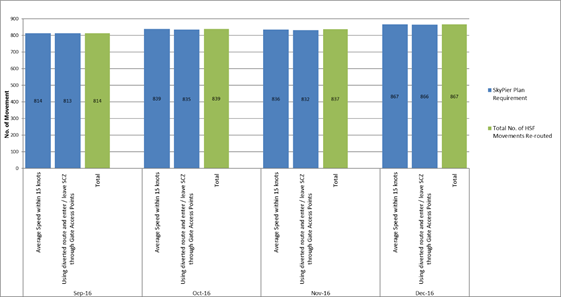
All the HSFs had travelled through the SCZ with average speeds within 15 knots (7.3 knots to 14.6 knots), which complied with the SkyPier Plan, except one HSF travelled at an average speed of 16.4 knots as the captain had to give way to an approaching vessel to ensure safety. Ten ferry movements had deviations from the diverted route during the reporting period. Notices were sent to the ferry operators and the cases have been investigated. Nine of cases were due to public safety considerations, i.e., strong tidal wave and current or giving way to other vessels, and the HSFs had returned to the normal route following the SkyPier Plan as soon as practicable. In November, one ferry did not travel through the diverted route on 22 November 2016. Further information has been requested from the concerned Ferry Operator (FO) and ET’s investigation found that the concerned captain decided to bypass the SCZ so as to reduce the travel time due to passenger misbehaviour incident happened during passenger loading at SkyPier. After the incident, the concerned captain has been instructed to follow the requirements of the SkyPier Plan. Letter has also been sent to other captains of the same FO to remind them the SkyPier Plan requirements. The summary of the SkyPier Plan monitoring result (October to December 2016) is presented in Graph 3.
Insufficient Automatic Identification System (AIS) data were received from some HSFs during the reporting period. After investigation, it was found that missing of AIS data for the concerned ferries were due to interference effect of AIS signal as reported by the FO after checking the condition of the AIS transponders. Vessel captains were requested to provide the radar track photos which indicated the vessel entered the SCZ though the gate access point and no speeding in the SCZ. Ferry operator’s explanation has been accepted.
Graph 3: Summary of SkyPier Plan Monitoring Results (October to December 2016)
2.9
Audit of Construction and Associated Vessels
The audit of construction and associated vessels in accordance with the MTRMP-CAV has been started in August 2016. ET has conducted weekly audit of relevant information including AIS data, vessel tracks and other relevant records to ensure sufficient information has been provided by the contractors to the Marine Traffic Control Center (MTCC) and the contractors are complied with the requirements of the MTRMP-CAV. The contactors have submitted endorsed 3-month rolling programme for construction vessel activities to MTCC in order to help maintain the number of construction vessels to a practicable minimum. The IEC has also performed audit on the compliance of the requirements as part of the EM&A programme.
Between October and December 2016, deviations including speeding in the works area, entry from non-designated gates, not following the designated route and entering no-entry zones were identified. All the concerned contractors were reminded to comply with the requirements of the MTRMP-CAV during the weekly MTCC audit and such deviations were also reviewed during the Environmental Management Meeting.
A total of 14 skipper training workshops have been held by ET between October and December 2016 with 260 concerned captains of construction vessels associated with the 3RS Contracts to familiarise them with the predefined routes, general education on local cetaceans, guidelines for avoiding adverse water quality impact, the required environmental practices / measures while operating construction and associated vessels under the Project, and guidelines for operating vessels safely in the presence of CWDs. Another 16 skipper training workshops have been held with 74 concerned captains by contractor’s EO and competency test had been conducted subsequently with the trained captains by ET. In addition, ET had participated in the 3rd, 4th, 5th Marine Management Liaison Group meeting held on 24 October, 28 November, and 19 December 2016 to assist and resolve any marine issues which may be encountered under 3RS Project.
2.10 Review of the Key Assumptions
Adopted in the EIA Report
With reference to Appendix E of the Updated EM&A Manual, it is noted that the key assumptions adopted in approved EIA report for the construction phase are still valid and no major changes are involved. The environmental mitigation measures recommended in the approved EIA Report remain applicable and shall be implemented in undertaking construction works for the Project.
3
Report on Non-compliance,
Complaints, Notifications of Summons and Prosecutions
3.1
Compliance with Other Statutory Environmental Requirements
During the reporting period, environmental related licenses and permits required for the construction activities were checked. No non-compliance with environmental statutory requirements was recorded.
3.2
Analysis and Interpretation of Complaints, Notification of
Summons and Status of Prosecutions
3.2.1
Complaints
During the reporting period, a complaint was received on 29 December 2016 regarding night time work at Sheung Sha Chau. The case is currently under investigation in accordance with the Complaint Management Plan.
3.2.2
Notifications of Summons or Status of Prosecution
During the reporting period, neither notifications of summons nor prosecution were received.
3.3
Cumulative Statistics
Cumulative statistics on exceedance, non-compliance, complaints, notifications of summons and status of prosecutions are summarized in Table 3.1 and Table 3.2.
Table 3.1: Statistics for Valid Exceedances for the Environmental Monitoring
|
|
|
Total No. Recorded in the Reporting Month |
Total No. Recorded since the Project Commenced |
|
1-hr TSP |
Action |
0 |
0 |
|
|
Limit |
0 |
0 |
|
Noise |
Action |
0 |
0 |
|
|
Limit |
0 |
0 |
|
Waste |
Action |
0 |
0 |
|
|
Limit |
0 |
0 |
|
Water |
Action |
0 |
0 |
|
|
Limit |
0 |
0 |
|
CWD |
Action |
0 |
0 |
|
|
Limit |
0 |
0 |
Remark: Exceedances, which are not project related, are not shown in this table.
Table 3.2: Statistics for Non-compliance, Complaints, Notifications of Summons and Prosecution
|
Reporting Period |
Cumulative Statistics |
|||
|
|
Non-compliance |
Complaints |
Notifications of Summons |
Prosecutions |
|
This reporting period |
0 |
1 |
0 |
0 |
|
From 28 December 2015 to end of the reporting period |
0 |
1 |
0 |
0 |
4 Conclusion and Recommendation
In this quarterly period from 1 October 2016 to 31 December 2016, the EM&A programme has been implemented as planned, including 96 sets of air quality measurements, 65 sets of construction noise measurements, 39 sets of water quality measurements, 6 complete sets of vessel line-transect surveys and 15 days of land-based theodolite tracking survey effort for Chinese White Dolphin (CWD) monitoring, three ecological monitoring on Sheung Sha Chau Island, as well as environmental site inspections, landscape & visual, and waste monitoring for the Project’s construction works.
The key activities of the Project carried out in the reporting period included five in-progress DCM contracts, an advanced works contract, and a CLP cable diversion enabling work contract. The DCM contracts involved DCM trials, laying of geotextile and sand blanket; the advanced works contract involved HDD pilot hole drilling, site preparation works and construction of containment pit, casing installation, and pipeline supporting works; and the CLP cable diversion enabling work contract involved installation of silt curtain, excavation works and removal of armour rock, construction of drawpit, installation of cable trough, backfilling, and reinstatement.
For water quality, the monitoring results for DO, total alkalinity, and chromium obtained during the reporting period were in compliance with their corresponding Action and Limit Levels. For turbidity, SS and nickel, some of the testing results exceeded the relevant Action or Limit Levels during the reporting period. Investigations were carried out immediately for each of the exceedance cases, and the investigation findings concluded that all the exceedances were not due to the Project.
No breach of the Action or Limit Levels in relation to the construction dust, noise, waste and CWD monitoring were recorded during the reporting period. All site observations made by the ET were recorded in the site inspection checklists and passed to the contractor together with the recommended follow-up actions. No encroachment or disturbance to the egretry area on Sheung Sha Chau was recorded during monthly ecological monitoring.
In total, 2,543 ferry movements between HKIA SkyPier and Zhuhai / Macau were audited in the reporting period. All the HSFs had travelled through the SCZ with average speeds within 15 knots, which complied with the SkyPier Plan, except one HSF travelled at an average speed of 16.4 knots as the captain had to give way to an approaching vessel to ensure safety. Nine ferry movements had minor deviation from the diverted route during the reporting period and all of them are related to public safety / emergency situations. In November, one ferry did not travel through the diverted route as the concerned captain decided to bypass the SCZ due to passenger misbehavior incident happened during passenger loading at SkyPier. After the incident, the concerned captain has been instructed to follow the requirements of the SkyPier Plan.
Between October and December 2016, ET has conducted weekly audit of relevant information to ensure sufficient information has been provided by the contractors to the MTCC and the contractors are fully complied with the requirements of the MTRMP-CAV. A total of 14 skipper training workshops have been held by ET between October to December 2016 with concerned captains of construction vessels associated with 3RS contracts. Another 16 skipper training workshops have been held by contractor’s EO and competency test had been conducted subsequently with the trained captains by ET.
On the implementation of Marine Mammal Watching Plan, silt curtains were in place by the contractor of CLP cable diversion enabling works as well as the DCM contractors for sand blanket laying works and dolphin observers were deployed in accordance with the Plan. On the implementation of DEZ Plan, Dolphin observers were deployed by contractors for continuous monitoring of the DEZ for DCM trial works in accordance with the DEZ Plan. Trainings for the dolphin observers were provided by the ET prior to the aforementioned works, with the training records kept by the ET. Testing on night vision devices for DEZ monitoring was also conducted before the DCM trials. From the contractors’ daily observation records and DEZ monitoring log records, no dolphin or other marine mammals were observed within or around the DEZ and silt curtains in this reporting quarter.
The recommended environmental mitigation measures, as included in the EM&A programme, have been effectively implemented during the reporting period. Also, the EM&A programme implemented by the ET has effectively monitored the construction activities and ensure the proper implementation of mitigation measures.